
As an analyst, your job isn’t just to crunch numbers, it’s to guide your audience through an airtight investigation. Ditch the flood of dashboards, charts, and raw metrics. When you overwhelm, you lose them. Instead, break complexity into progressive, deliberate, and digestible steps. Build your case like evidence in a trial, each point reinforcing the next, until the conclusion feels inevitable.
But here’s the truth: numbers alone don’t persuade, stories do. A compelling narrative is what keeps people engaged. It’s what bridges the gap between complex analytics and non-technical stakeholders like executives, sales leaders, or cross-functional partners. And yet, not every audience wants a story. Not every moment calls for one. To drive action, insight must be structured. It has to fit the rhythm of the conversation, the mindset of the room, and the stage of the decision. Sometimes you’re guiding stakeholders through a key turning point. Sometimes you’re unpacking what happened when the plan met reality. And sometimes, you’re facing an executive who has five minutes, no context, and zero patience for storytelling.
That’s why this playbook revolves around 3 distinct modes of delivery, each suited to a different moment in the lifecycle of a strategic initiative. When you’re recommending a solution, whether operational or strategic, the SCIQARIO model [1] gives you a clear narrative structure to frame the stakes, guide the thinking, and lead your audience to a compelling, data-backed decision. When the solution has been implemented and it’s time to evaluate, the post-mortem version of SCIQARIO [2] helps you reflect with rigor: what worked, what didn’t, and what the experience taught you. And when you’re communicating to executives who don’t want a story but a conclusion, the Minto Pyramid model [3] cuts straight to the point: answer first, logic second, clarity always.
1. The SCIQARIO Model: Presenting the Move

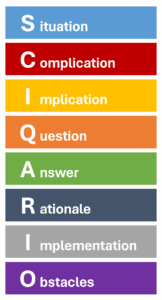
I’ve developed the SCIQARIO model as a hybrid storytelling framework inspired by the best of McKinsey, Harvard and Deloitte. And yes, it sound like the Mexican hitman played by Benicio del Toro in Denis Villeneuve’s excellent 2015 film Sicario. That’s intentional. I wanted it to be unforgettable. It stands for Situation, Complication, Implication, Question, Answer, Rationale, Implementation, Obstacles. This is my go-to signature methodology, narrative-driven, persuasive, and strategic. It creates tension, sets stakes, and walks your audience toward the insight, grounded in both logic and relevance.
Use it to pitch demand gen initiatives, a change in bidding strategy, a lead scoring model redesign, a martech bug in resolution, the calls to aciton in weekly campaign performance review, or to rectify underperformance in a sacred cow channel. Whether you’re presenting to technical analysts, or non-technical stakeholders, they need to be both influenced by an emotional pull and business relevance. So SCIQARIO helps you land the message with confidence.
Situation. Establish the context and what’s “normal”. This is the calm before the storm, the baseline, the status quo, the expected pattern. Set the stage with familiarity to ground your audience. Use this moment to frame the domain, give relevant background, and show that you understand their world. It’s not just about data, it’s about relevance. Grab the attention just enough to explain why the initial normal previously mattered. Make the audience feel grounded. They should nod along and say: “Yes, that’s where we were”. Avoid jargon, make it universally graspable. Use simple, concrete metrics or behavioral norms to anchor it to something business-critical, either pipeline, engagement, retention or revenue.
| Campaign Channel | Lead Scoring Model | Lead Attribution | Sales Pipeline | Martech Platform |
|---|---|---|---|---|
| Webinars drove 35% of lead gen pipeline last year, making them our top-performing awareness channel. | Current lead scoring model hasn’t been updated in 18 months, and is still calibrated on high-volume engagement behavior. | Marketing performance dashboards rely on first-touch attribution, which has been the default model for over a year. | The EMEA sales team currently shows strong pipeline coverage (3.2x target) and consistent early-stage engagement. | A new marketing automation platform was rolled out 4 months ago to centralize campaign management and improve personalization. |
Complication. Now introduce the disruption, the crack in the system. This is the moment tension enters the story. Something shifted: performance dropped, behaviors changed, a pattern broke. What’s different now? Use this section to spark curiosity, and expose friction. It’s the “wait, something’s off” moment. Use specific, recent changes to raise the red flag. Time-bound shifts are the strongest. Show that this isn’t just a dip, it’s a pattern break. Do not highlight the stakes, the gaps, or the risks, that’s next section role. Just build intrigue and hint at potential impact without diving too far ahead.
| Campaign Channel | Lead Scoring Model | Lead Attribution | Sales Pipeline | Martech Platform |
|---|---|---|---|---|
| Attendance rates have dropped 40% over the past 2 quarters, while CPL has doubled despite consistent promotion levels. | Sales reports a recent surge in low quality junk leads still being marked as MQLs. | Multiple teams report conflicting ROI between paid and organic channels, creating growing attribution tension. | Conversion from proposal to close is down 35% over the past 2 quarters, despite healthy top-of-funnel metrics. | Despite enablement sessions, less than 35% of regional marketers are actively using the new platform. Campaigns are still being run on legacy systems. |
Implication. Make the audience lean in. Show business relevance by connecting the dots between the complication and business impact. What’s at risk in the business? What opportunities to leverage are being missed? You don’t trigger curiosity anymore. Now you raise interest, provoque concern and escalate urgency by linking the issue to what your stakeholders care about: revenue, churn, reputation, efficiency, brand, risk, growth, ROI. Use phrases like “puts at risk”, “jeopardizes”, or “could unlock” to emphasize impact. Also quantify it whenever possible, in order to make the cost of inaction or the reward of action crystal clear. Use emotional triggers such as time-boxed impact statements like “every week, …”, accountability reminders or competitive challenges like “can we do better than …”. Finally, you close the implication part by connecting the business impact to business stakes: why resolving the complication matters. This makes a good transition to the next part of your presentation.
| Campaign Channel | Lead Scoring Model | Lead Attribution | Sales Pipeline | Martech Platform |
|---|---|---|---|---|
| This under- performance is putting round $800K in pipeline at risk for Q3, while absorbing a disproportionate share of budget. | 1 in 3 Sales Rep hours are now spent on unqualified leads. Opportunity cost is growing to $400K in missed SQOs projected this quarter. | Budgeting for Q3 growth campaigns is stalled. Risk of misallocating $500K across low-impact channels. | Round $1.2M in forecasted revenue is stuck in limbo. It’s eroding rep confidence and affecting quota attainment. | Fragmented execution blocking full-funnel visibility, delaying segmentation-based activation, and increasing time-to-launch by 2 weeks. |
Question. Time to sharpen the focus. What is the core dilemma or strategic decision point? This is where you pose the high-stakes question your solution will answer. Create a desire for resolution. It should feel urgent, directional, and relevant, something they want an answer for, now. Frame it in a way that triggers both emotional and strategic engagement. Keep it open-ended but sharp, avoid making it too tactical, this should still sound like strategy. Think of it as tightening the spotlight: “Given what we now see, what do we do?”
| Campaign Channel | Lead Scoring Model | Lead Attribution | Sales Pipeline | Martech Platform |
|---|---|---|---|---|
| What’s driving the decline, and do we optimize, reduce, or retire webinars? | How can we redesign lead scoring to better prioritize high-intent buyers and reduce qualification noise? | How can we fix attribution logic to reflect true channel influence and unlock confident investment decisions? | What’s causing late-stage friction, and how can we restore velocity from proposal to close? | What’s holding back adoption, and how do we restore consistency and speed across regions? |
Answer. Deliver the move, the “now what”. Present your recommended solution or direction with clarity and confidence. This isn’t about dumping data, it’s about taking a stand. What’s the strategic call to action? What decision should be made? Make your recommendation specific, actionable, and tied to the problem you just built. Don’t be too ambitious here and avoid overwhelming yourself with building the perfect recommendation or the final solution. You’re offering a path forward, one that feels necessary, logical, and before all, doable. Keep language simple and direct. Avoid weasel words like “consider” or “perhaps”. Frame your solution to clear next steps before expanding in the next sections. It is a way of introducing what we will be talking about.
| Campaign Channel | Lead Scoring Model | Lead Attribution | Sales Pipeline | Martech Platform |
|---|---|---|---|---|
| Reduce webinar volume by 50%, reinvest in interactive formats like Workshops and Ask me Anything, and align topics to current buying signals. | Implement intent signal weighting, deprioritize high-volume low-fit behaviors, and align scores with historical closed-won patterns. | Transition to a weighted multi-touch attribution for mid- to high-consideration journeys. | Increase exec sponsor involvement and introduce a structured buyer enablement kit including ROI calculator, case study decks, objection handling scripts. | Launch a 3-phase recovery plan: retrain power users, embed templates and playbooks into the platform, and assigning regional platform champions with activation KPIs. |
Rationale. Now justify your solution and path forward. Rationale is where emotional pull and logical rigor meet. So build trust. Your audience should feel that this decision wasn’t impulsive, it was intentional. It shows you didn’t just guess, you weighed, compared, and chose wisely. Explain why this solution meets your stakeholders needs, why it aligns to the company’s long-term objectives and why it makes sense, given the context, constraints, and stakes. Back your recommendation with your reasoning presenting supporting evidence, proof data points, benchmarks, examples, or quick wins. Show A/B test results from similar cases, reference industry benchmarks that validate your claim, present before-and-after data from past optimizations. Remember, a picture is worth a thousand words so go straight to your strongest proof. The goal is to leave your audience with no choice but to agree. And don’t hide the trade-offs but acknowledge them and show why your option still stands. Compare alternatives and show the pros and cons when necessary. Explain what will happen if we don’t apply the solution. You will remind the quantified cost and rewards highlighted in the section “Implication” and add more key details to it. So structure your rationale as: Answer → Evidence 1 to 3 max → Trade-off. You’re actually highlighting the Opportunities of the project SWOT here by revealing its growth portential or upside.
| Campaign Channel | Lead Scoring Model | Lead Attribution | Sales Pipeline | Martech Platform |
|---|---|---|---|---|
| Engagement data shows webinar fatigue driven by outdated segments and repetitive messaging. Quick shifts to live Q&A formats doubled engagement and cut CPL by 30%. A minimal update in Region B lifted engagement by 30%, proving we can recover quickly without a full redesign. | Behavioral data shows that visits to intent-rich pages (pricing + integration) convert 3x higher than content downloads. Reweighting these signals during testing improved lead-to-SQO by 42%, confirming our new model drives better prioritization. | Journey analysis revealed 70% of closed deals involve 3+ touchpoints. First-touch inflates SEO, last-touch over-credits email. Testing a weighted model showed that a 20% budget shift to under-credited channels could yield 15% ROI lift. | Win-loss interviews highlighted a missing layer of buyer enablement. Kits help buyers justify the purchase internally which our current flow didn’t address so far. Regions using toolkits closed deals 26% faster. | Regional usage is 3x higher where platform champions exist. Feedback points to workflow confusion, not tool capabilities. A small APAC pilot reduced time-to-launch by 45%, proving that embedded support and templates drive adoption fast. |
Implementation. Operationalize your solution now. Translate strategy into execution. Outline how the plan unfolds. This is not a to-do list, it’s a mini roadmap. Surface what needs immediate attention out from what’s just noise. What’s urgent? What’s important? What should be handled first, scheduled later, delegated or just eliminated? Break complexity into manageable steps. Suggest a series of incremental improvements such as a pilot experiments, prototypes, preliminary results or test scenarios rather than a single major company-wide push. Small wins first will build trust and keep momentum going. Also, fast and tangible progress will reassure your stakeholders rather than a massive and complex final delivery that risks stalling execution. To be able to deliver these structured increments, you need to push this roadmap further than next steps, so show you’ve thought through cross-functional coordination and think: roles, deliverables, resources, ownership, milestones, timeline. Be specific about the timeline: “next week” is better than “soon”. And careful, once you share your roadmap, stick to Service-Level Agreements (SLAs) and deliver what’s promised on time, even if it’s a minimal viable solution (MVP). Though, stick to tactical and actionable logistics. Do not cover risk mitigation. Leave uncertainty, dependencies and friction for the next section. Think of this like a project plan snapshot, not a project risk register. Here, you’re surfacing the Strengths of the project SWOT by justifying feasibility and internal advantage.
| Campaign Channel | Lead Scoring Model | Lead Attribution | Sales Pipeline | Martech Platform |
|---|---|---|---|---|
| Content team finalizes Q2 topic realignment in 2 weeks. New format pilots for workshops, and AMAs launch in 4 weeks. Track post-event MQL conversion for 2 weeks. | Marketo scoring logic updated with Martech in 2 weeks. Sales Rep playbook alignment session held by end of week. Weekly monitoring of lead velocity and SQO ratio begins immediately. | Weighted attribution logic applied in Salesforce. Dashboard with updated logic goes live in 2 weeks. Biweekly syncs scheduled with Finance and Channel leads for validation. | Enablement kits delivered in a month. Regional sales managers run weekly coaching sessions using toolkit assets immediately post delivery. | Live retention clinics launch this week. Templates & playbooks embed into platform in 2 weeks. Regional champions nomination & activation tracking dashbaord launch in 3 weeks. |
Obstacles. Preempt resistance. What might block success? Surface external threats like market shifts, legal or budget changes; and surface internal execution risks, dependencies, resource gaps, delays and potential failure points that could derail the implementation of the solution. Also, address organisational resistance like sensitive politics, misalignments or pushbacks. Be honest but stay constructive and proactive: show you’ve thought about these challenges and are prepared to demonstrate resilience or to mitigate them. No need to solve them all here, just flag that you’re prepared. By naming the potential blockers early, you turn risk into readiness and friction into foresight. Finally, position this section as a strength, not a weakness by extracting your key success factors. You’re closing your case like a strategist: “Here’s what could go wrong … (show honesty) … but here’s why we’re prepared … (show confidence) … and here’s what to watch … (show empowerment)”. The best way to surface the project Weaknesses and Threats of the project SWOT is by showing executive maturity, strategic realism, and accountability.
| Campaign Channel | Lead Scoring Model | Lead Attribution | Sales Pipeline | Martech Platform |
|---|---|---|---|---|
| Risk of executive pushback as webinars are still brand-defining. Critical Sales enablement & coordination to shift outreach and avoid overlap. Delayed CRM audience criteria will stall launch. | Marketing may resist due to expectedshort-term MQL drop. Success metrics must be reframed around pipeline impact, not lead volume, to avoid perception of under performance. | Attribution model changes will disrupt historical benchmarks. Requires stakeholder training, forecasr recalibration, and support during transition. | Reps may resist new process layers. To maintain momentum, we need early proof points and regional champions to normalize toolkit usage. | Legacy workflows remain in place in some regions. Risk of perceived centralization without strong VP-level sponsorship. Need for ocal success stories and “empowerment” communication. |
2. The Post-Mortem SCIQARIO : Owning the Outcome

Now that a strategic recommendation has been presented and implemented, the job isn’t done. You shift from persuasion to reflection. A post-mortem is where you demonstrate how you measure the impact of a solution, assess its execution, and learn from its outcome. But strong, meaningful post-mortems rarely emerge from clean, frictionless projects. They’re forged through real-world complexity where assumptions are tested, unexpected surprises arise, and strategy meets operational reality. In practice, post-mortems are often skipped when things go smoothly due to time constraints. Occasionally, they’re requested when something worked exceptionally well, mainly to document best practices. But most often, you’ll be asked to run one when an initiative didn’t go as planned. That’s why a post-mortem isn’t just about wrapping up the story with a tidy lesson. It’s about surfacing what remains unresolved, what needs further investigation, and what the current results failed to explain. The post-mortem version of the SCIQARIO framework gives you the structure to review performance with the same rigor and clarity you used to present the original strategy.
Situation. What we set out to do with the project we are doing a post mortem on and how. This step is a precise recap of the original strategic intent. It re-establishes the purpose of the initiative in business terms: what decision was made (Answer), what objective it served (Rationale), and what outcome was expected (Implementation). Keep it tight. One paragraph is enough. The power is in its simplicity. This is not the place to re-justify your thinking and to re-persuade. The recommendation has already been accepted. The goal now is to create alignment around the original intent before unpacking what actually happened. It anchors the post-mortem in context. And careful, don’t dilute or rewrite your original goal to match the current outcome. Integrity matters.
| Campaign Channel | Lead Scoring Model | Lead Attribution | Sales Pipeline | Martech Platform |
|---|---|---|---|---|
| We recommended cutting webinar volume by 50% and reinvesting in more interactive formats (workshops, AMAs), with content aligned to current buyer signals. The goal was to reverse the engagement decline and protect $800K in pipeline. The rollout was staged over 4 weeks, tracked through post-event MQL conversion metrics. | We updated the scoring logic in Marketo to prioritize high-intent behaviors (pricing, integration views). The intent was to improve lead-to-SQO rates. Implementation included logic updates in 2 weeks, SDR alignment sessions, and weekly tracking of performance. | We transitioned from a first-touch model to weighted multi-touch attribution in Salesforce to correct channel miscrediting and unblock budget planning. The objective was to reflect true influence across buyer journeys and reallocate spend for higher ROI. Execution included a dashboards & cross-functional alignment. | We introduced a buyer enablement kit (ROI calculators, objection handling, case studies) and increased executive sponsor involvement to fix mid-funnel stalling. The goal was to accelerate velocity and recover $1.2M in forecasted revenue. Delivery was set for one month, with weekly coaching post-rollout. | We launched a 3-phase 3 weeks recovery plan: retraining power users, embedding templates and playbooks, and appointing regional platform champions with activation KPIs. The aim was to drive martech adoption beyond 35% and to recover time-to-launch. Clinics launched first, then templates and dashboards. |
Complication. What emerged during execution that wasn’t anticipated? This is where you shift from what was planned to what actually happened. The goal is not to assign blame but to surface friction like unexpected changes, operational delays, missed assumptions, or emerging risks that challenged your execution. It might be internal (process misalignment, resource delays, cross-functional resistance) or external (market shift, regulatory update, stakeholder turnover), but either way, it altered the smooth path from strategy to action. Don’t defend or excuse. Name the friction, not the culprit and own your shared responsibility. Be factual, not defensive. Avoid the instinct to dramatize or downplay. If the friction is still unclear, state it. Acknowledge ambiguity. Uncertainty is better than speculation. Executives aren’t looking for perfection, they’re looking for truth paired with composure. So link this section to risks, not emotions. Show how the complication disrupted timelines, resourcing, or expected impact, not how it disrupted team morale, dynamics, or mood. This section is also the bridge between your original expectations and the actual outcomes, setting up the rest of your diagnostic with credibility.
| Campaign Channel | Lead Scoring Model | Lead Attribution | Sales Pipeline | Martech Platform |
|---|---|---|---|---|
| Interactive pilots took longer to design than scoped. Final content approvals slipped by 2 weeks due to competing launches. Some regions reused legacy webinar formats despite revised plan. | Scoring update triggered short-term MQL volume dip, sparking internal concern about hitting marketing KPIs. Sales Reps flagged that some high-intent behaviors weren’t being tracked consistently across channels. | The new weighted model surfaced inconsistencies in campaign tagging. Some legacy campaigns lacked multi-touch data, creating gaps in the new dashboards. Training on interpreting attribution shifts wasn’t fully adopted. | Toolkit assets were delayed due to legal and branding review cycles. Some reps skipped enablement sessions or continued using old decks. Exec sponsors didn’t consistently engage across all regions. | Template embedding was slower than planned due to platform permission issues. A few regions pushed back against centralized materials. Dashboard adoption was uneven. |
Implication. What changed after implementation? What was the actual business outcome? This is where you assess the real impact of the strategic move. Did the solution move the needle or not? What improved, what stayed flat, what unexpectedly declined? Then you go further than assessing the impact, you connect execution to outcome. Was the original business goal achieved? If not, how far off were you, and why? If so, what does that unlock going forward? Avoid vague or inflated language. Show directionality and measurable shifts by anchoring your outcome in a baseline, showing before and after and by focusing on metrics that were originally chosen to quantify success. Keep it strategic. Link your feedback to business stakes, not operational anecdotes. Avoid emotional conclusions or surface-level commentary. You’re not here to say “things went well” or “we hit a few bumps.” You’re here to define how the solution impacted the business. Most importantly: be honest about both gains and gaps. Whether the results were positive, negative, or mixed, you have to state the outcome with objectivity and clarity. Separate intended impact from unintended side effects. Both matter, but don’t confuse them. You’re not proving the solution was perfect, you’re showing that the strategy was implemented, measured, and evaluated rigorously.
| Campaign Channel | Lead Scoring Model | Lead Attribution | Sales Pipeline | Martech Platform |
|---|---|---|---|---|
| Engagement recovered modestly: Q&A sessions lifted participation by 22%, but content alignment varied by region. CPL decreased by 18%, short of the 30% benchmark. $500K in pipeline secured, but we didn’t fully recover initial $800K risk. | Lead-to-SQO rate improved by 27% vs. previous baseline, but still below the 42% gain observed during testing. MQL volume dropped 19%, triggering internal tension, but quality metrics improved. | ROI visibility improved across 60% of campaigns with full data tagging, but gaps persisted for older campaigns. Budget allocation resumed for Q3, but channel budget shifts were more conservative than modeled. Attribution trust increased, but user training remains inconsistent. | Close velocity improved by 17% across regions that adopted kits fully. But, uneven global rollout. In regions where coaching was skipped or exec sponsors disengaged, no performance lift was observed. The initiative recovered 65% of the forecasted stalled revenue. | Platform adoption rose to 58% overall, with sharp gains in regions where champions were active. Time-to-launch reduced by 25%, but dashboard usage remained low in 2 regions (out of 6). Activation KPIs were met, but localization feedback remains unresolved. |
Question. This step is about showing maturity: you don’t just implement, you interrogate. What do we need to understand now? What new questions were raised after implementation? This is the reflective pause. After outcomes are reviewed, you shift from “what happened” to “what still needs clarity”. This is neither an operational or strategic prompt for what comes next, nor a rhetorical question meant to wrap the story with a tidy lesson. It’s about surfacing what remains unresolved, what needs further investigation, or what the current results failed to explain. You may have to point to a blind spot in the original strategy, a behavioral pattern not previously considered, or a shift in stakeholder response. Articulate the gaps, the uncertainties, and the variables that deserve attention in the next phase. This section invites the room into forward-thinking mode, not to close the loop but to open the next one. Though, you don’t need to invent a grand insight here. Sometimes the smartest move is acknowledging what you still don’t know. Don’t force a “lesson learned” if there isn’t one yet.
| Campaign Channel | Lead Scoring Model | Lead Attribution | Sales Pipeline | Martech Platform |
|---|---|---|---|---|
| Why did some regions stick to legacy formats despite alignment efforts? Did we underestimate regional autonomy or over-rely on centralized content strategy? | Are we now under-prioritizing leads that convert with lower digital signals? Should we revisit the scoring logic to account for more subtle, mid-funnel behaviors? | How do we fully integrate historical campaigns into the new model without corrupting data integrity? What’s the right level of training to ensure consistent interpretation across teams? | Why did exec sponsor involvement drop off in some regions? Was the role definition unclear, or was there a perception of low added value? | What’s still blocking dashboard usage in key regions despite activation tracking? Are we facing a capability issue or a cultural resistance to centralized tooling? |
Answer. This is where we move from observation to explanation: the diagnostic layer begins. After reflecting on what worked, what didn’t, and what surprised us, we now ask: Why did this happen? What answers do we have to the questions raised post-implementation? This is where we connect outcomes to causes, turning experience into insight. This section captures the strategic learning outcome of the initiative. What did we learn from executing a solution that didn’t fully deliver on its promise? What core drivers of success or failure did we uncover? What misalignments or faulty assumptions were exposed? Which failure points or underperforming segments revealed gaps in our strategy? What operational blind spots did we surfaced during rollout such as unexpected stakeholder behaviors, timing conflicts, or cross-functional breakdowns? Maybe an initiative underperformed in a key region because the message failed to resonate locally. Maybe adoption lagged because rollout timing conflicted with other campaigns. Maybe engagement dropped because of overconfidence in a reused asset, or because competing initiatives diluted focus. The point here is to uncover root drivers, the few elements that materially shaped most of the unexpected outcome. Focus on 2 to 3 actionable insights. These should be causal, not just correlative. Don’t attempt to account for every detail, concentrate on what truly matters for future decision-making. And above all, be honest. The strongest post-mortem insights don’t attempt to validate the original idea but they build on it. Own your surprises. Flag false positives. If something appeared successful but didn’t hold under scrutiny, call it out. Acknowledge what defied your expectations, it’s not a weakness, it’s a marker of curiosity, maturity, and real strategic growth.
| Campaign Channel | Lead Scoring Model | Lead Attribution | Sales Pipeline | Martech Platform |
|---|---|---|---|---|
| Reused webinar formats create hidden audience fatigue that content refresh alone cannot fix. Regional teams default to legacy formats when rollout guidance is unclear. Audience drop-off is worsened by competing campaign timing. | Models deprioritizing engagement signals tend to overcorrect and lack nuance hence suppressing lead volume more than intended. Sales Rep not adjusting workflows with new scoring quickly lead to misalignment. | Legacy tagging skews inputs. Teams hesitate if forecast impact is unclearn or they find guidance gaps. | Toolkit success depends on coaching and sponsor visibility. Regions without clear ownership see no change. Content quality alone isn’t the driver, you also need sponsorship. | Platform adoption improves only in regions with empowered champions advertising key wins. Friction comes from access delays, lack of templates, and poor onboarding sync. |
Rationale. The purpose of this section is to explain why things unfolded the way they did and help inform the next decision. Done well, this section proves that your team doesn’t just react to outcomes, they translate them into learning. A strong rationale blends quantitative signals with qualitative context to create a coherent explanation of performance. Pull from usage metrics, performance trends, feedback loops, win/loss conversations, adoption behaviour. But don’t treat them in isolation. The key is to balance data and voice-of-stakeholder because metrics show what happened but feedback reveals the why behind it. Then group the causes into pattern. If multiple small frictions roll up to one strategic issue like a lack of enablement for instance, name the pattern, not each friction instance. Isolated anecdotes aren’t useful unless they ladder up to something strategic. So stay focus on what matters. Don’t over-analyze side details or invent causal links just to tidy up the story. Don’t jump to conclusions with surface-level speculation. If results were mixed or inconclusive, say so. And above all, don’t mask the misses. You gain more trust by confronting gaps head-on than by explaining them away.
| Campaign Channel | Lead Scoring Model | Lead Attribution | Sales Pipeline | Martech Platform |
|---|---|---|---|---|
| Event metrics showed bounce/drop-off for reused templates, confirming saturation. Regional comms revealed format changes weren’t clearly reinforced. Competing product launch dates cannibalized attention and promo cycles. | Behavior tracking gaps across web and email channels meant some intent signals like event participation or low site engagement were underrepresented. Sales Rep feedback highlighted lack of examples and missed playbook updates. MQL dip created internal pressure to revert. | Inconsistent UTMs + funnel-stage tagging and missing journey data weakened inputs. Finance flagged model misalignment with forecasts. Teams struggled to interpret the shift due to training fatigue and lack of role-specific guidance. | Coaching attendance logs revealed that most reps who didn’t adopt kits were also in regions with unclear sponsor ownership. Toolkits only worked when proactively used by AEs. Sponsor roles were loosely defined and perceived as optional, leading to uneven engagement. | Champion activation was inconsistent. Rollout timing clashed with otther initiatives, stalling momentum. Regions needed locally adapted assets and visible local wins. Delayed permissions and training gaps including skipped basics assuming tool fluency. |
Implementation. How should we proactively adjust going forward based on what we learned? What will we do differently next time? This is where reflection becomes operational and strategic improvement. Now that we’ve assessed what happened and why, it’s time to define how our approach evolves. What should be tweaked, optimized, or reinforced in future cycles? What process, habit, or insight worked well enough to replicated, scaled or become a standard? What strengths can be leveraged more fully? What slowed us down that we can now streamline? The goal here is not to create a checklist of tasks, it’s to outline refinements to our methods, decision frameworks, procedures, communication habits, or model. Focus on what should be replicated, adapted, or retired to sharpen execution in the next iteration. Where do we need clearer alignment, tighter sequencing, or a smarter way of validating early signals? Demonstrate adaptability, but avoid overcorrecting for isolated outcomes. Look instead for recurring patterns that are worth evolving. These adjustments could apply to how we frame future initiatives, how we segment audiences, how we communicate progress, or how we prioritize collaboration across stakeholders. These are the shifts we own, the improvements in how we approach, deliver, and optimize work. The focus here is agency, not risk.
| Campaign Channel | Lead Scoring Model | Lead Attribution | Sales Pipeline | Martech Platform |
|---|---|---|---|---|
| Standardize workshop/Q&A formats with regional opt-in options. Introduce pre-launch sequencing audits to avoid cross-campaign collisions. Build a content expiration tracker to avoid legacy reuse by default. | Establish joint calibration reviews with Sales Rep leaders before rollout. Add behavioral recency weighting and test against multiple funnel paths. Build a scoring sandbox to simulate outcomes before global activation. | Create a unified tagging taxonomy to reduce data integrity issues. Pair new dashboards with function-specific guides. Phase training with live case demos instead of static overviews. | Define sponsor accountability in kickoff docs and QBR follow-ups. Bake toolkit rollout into rep onboarding. Pilot AE-led internal champion coaching as part of proposal stage checklist. | Translate global templates into region-ready variants pre-rollout. Launch an internal enablement hub with on-demand flows and how-to videos. Appoint platform champions before enablement push, not after. |
Obstacles. This section identifies what we need to watch for, even after improvement. It surfaces the risks that remain, whether they were anticipated or only became visible during execution. These include resurfaced friction, unresolved blockers, or new vulnerabilities that may not have derailed this initiative, but left unchecked, could impact future ones. The focus here isn’t optimization, it’s risk anticipation. What still needs to be flagged, monitored, or still needs to be investigated because current results failed to explain it? What factors are external, systemic, or cross-functional, things that can’t be solved by iteration alone but require sponsorship, coordination, or deeper structural change? These risks may call for political alignment, resource shifts, or tighter stakeholder engagement. They’re not signs of failure, they’re signs of experience. We’re not pointing fingers; we’re pointing headlights. The goal is to turn friction into foresight. This is where we name, clearly and neutrally, the issues that could limit scale, repeatability, or timing in future cycles. Whether it was breakdowns in coordination, hidden data dependencies, or soft executive support, call it out, and call it early. A strong obstacles section proves we’re not just aware of the risks. We’re already building the muscle to manage them next time.
| Campaign Channel | Lead Scoring Model | Lead Attribution | Sales Pipeline | Martech Platform |
|---|---|---|---|---|
| Webinar format changes may continue to face executive resistance due to brand equity concerns. Without a firm deprecation plan and regional buy-in, legacy content may quietly return. | Mktg KPIs are still volume-driven. If performance targets don’t evolve in parallel with quality goals, pressure to reverse scoring gains could surface. Sales Rep trust in scoring logic varies by region. | Attribution model shift may remain contested unless Finance, Performance, and Channel leads stay aligned in interpreting ROI implications. Data integrity still depends on cross-team tagging compliance. | Exec sponsor roles risk slipping back into ambiguity without formal reinforcement in sales ops processes. Toolkit use remains vulnerable to manager turnover or shifting enablement priorities. | Platform adoption may stall again without ongoing field-level advocacy. Tension between global process and regional autonomy could resurface unless early wins are maintained and scaled. |
3. The Minto Pyramid : Convincing at Speed
The Pyramid principle was developed by Barbara Minto in the 1970s during her time at McKinsey. The methodology is the go-to structure for CMOs, CROs, board members, and marketing operations leads; any stakeholder who values clarity over context and makes decisions based on structure, not sentiment. You shift into this mode when storytelling doesn’t land and time is limited. These stakeholders don’t need to be sold, they need to be convinced. You’re not delivering a narrative; you’re delivering an executive summary. The model removes the setup and compresses the insight into a top-down, logic-first structure: actionable conclusions first, concise reasoning second.
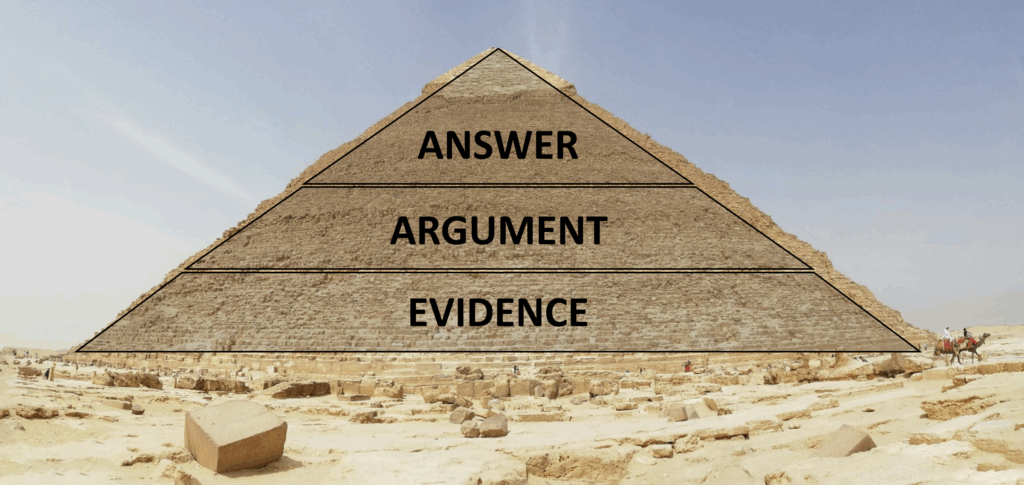
It forces clarity and organizes complexity into a format that aligns with the pace and expectations of high-level decision-makers. The Minto Pyramid is especially effective when proposing a major marketing budget reallocation, presenting insights for quarterly business reviews (QBRs), or explaining multi-step strategic plans such as market expansion or ICP redefinition to leadership.
Answer First. State your main recommendation upfront. No lead-in, no warmup, no buildup. You don’t climb toward the insights, you open with the move. This section mirrors the Answer section and the rimeline of the Implementation in the SCIQARIO structure. It should be short, one or two sentences at most, and framed in the language your stakeholders care about: impact, timing, and feasibility. Say what should happen, by when, and why it matters. Be direct, not decorative. No hedging, no qualifiers. And most importantly, trust the structure: you’ll have room to explain yourself afterward. But first, say what matters most.
| Campaign Channel | Lead Scoring Model | Lead Attribution | Sales Pipeline | Martech Platform |
|---|---|---|---|---|
| Reduce webinar volume by 50%, pilot new formats like Workshops and AMAs in 4 weeks, and realign topics to current buying signals. | Update Marketo scoring logic in 2 weeks to prioritize high-intent behaviors and align with Sales Rep workflows. | Apply weighted attribution logic in Salesforce and deploy updated dashboards in 2 weeks to unlock investment clarity. | Deliver enablement kits in a month and initiate weekly coaching sessions with regional sales managers to accelerate deal velocity. | Launch recovery plan this week with live retention clinics, embed templates in 2 weeks, and activate regional champions with tracking dashboard in 3 weeks. |
Supporting Arguments. Once your answer is out, your credibility depends on what follows and that’s where supporting arguments come in. This is your moment to signal control. Each argument must directly support the solution and be backed by clear and relevant evidence. They must also be Mutually Exclusive and Collectively Exhaustive: that’s another of Barbara’s principles, the MECE. That means no overlap, no redundancy, no repetition, and no gaps in logic. To get this right, treat each argument as a standalone sentence that could be read aloud in a boardroom without confusion. Write them as if they were slide titles. This is not the place for nuance or buildup. Don’t make the executive hunt for the point. State it cleanly and confidently. It’s the core idea, not the justification. If two arguments share phrasing or data, combine them or reframe. If a key objection isn’t addressed by any argument, add a fourth or fifth. Each point should be framed through a distinct strategic lens. One might focus on performance urgency (Complication), another on business impact (Implication), a third on feasibility or proof of effectiveness (Rationale), and a fourth on execution readiness (Implementation). Together, they give decision-makers everything they need to say yes or ask smart questions if not. And finally, every argument hits harder with a number attached so quantify wherever possible: risk in dollars, gain in percentages, or reduction in time all count.
| Campaign Channel | Lead Scoring Model | Lead Attribution | Sales Pipeline | Martech Platform |
|---|---|---|---|---|
| Attendance rates dropped 40%, while CPL doubled. $800K in pipeline at risk. Live Q&A pilots doubled engagement and cut CPL by 30%. Timelines locked, roles and tracking already scoped. | Surge in low-quality MQLs flagged. $400K in missed SQOs. Intent-rich reweighting improved lead-to-SQO by 42%. Timelines locked, roles and tracking already scoped. | ROI misalignment across paid and organic blocks decisions. $500K in Q3 growth budget stalled. Weighted model unlocks 15% ROI. Timelines locked, roles and tracking already scoped. | Proposal-to-close dropped 35%. $1.2M revenue stalled mid-funnel. Enablement kits improved velocity by 26%. Weekly coaching starts immediately after toolkit delivery. | <35% adoption, legacy tools still in use. APAC pilot showed 45% faster launch + 3x usage. 3-phase plan sequenced over 3 weeks. |
Justification Layers. Once your supporting arguments are in place, what follows is evidence. This is where you validate, quantify, or clarify the point directly above, nothing more. Your top-line message must remain clear even at a glance, while the justification offers depth for those ready to go further. Think of it as structural scaffolding: invisible at first, but essential when someone leans on your logic. Justification layers must serve the argument, not compete with it. If a data point doesn’t strengthen the case, cut it. Begin with the strongest test result or benchmark and focus on operator-grade evidence. Data that speaks directly to business impact, efficiency, or risk. Don’t stack endlessly: 2 to 3 focused, high-quality details per argument is the limit. If you need more, or if you find yourself introducing new logic, the argument may be too broad or you’re at risk of losing your audience before they reach the next point. Apply the same discipline here that you used when defining your arguments. The justification layer should be anchored in specificity. Avoid soft metrics, general statements, repeated phrasing or redundant proofs. Precision matters. This is where credibility is earned, and where your logic becomes unshakable under pressure.
| Campaign Channel | Lead Scoring Model | Lead Attribution | Sales Pipeline | Martech Platform |
|---|---|---|---|---|
| Decline in attendance happened despite consistent promotion levels. Webinars absorb disproportionate budget for diminishing results. Region B Q&A update showed 30% CPL lift from small changes. Realignment in 2 weeks, pilots in 4. | SDRs now spend 1 in 3 hours on junk leads. Pricing & integration views convert 3x higher. SDR playbook aligned this week. Weekly monitoring in place. Sales-Mktg sync confirmed. | First-touch inflates SEO; last-touch over-credits email. Teams requesting attribution clarity. Weighted model matches 70% multi-touch journeys. 20% reallocation tests showed 15% ROI lift. Finance & channel leads aligned in sync cadence. | No buyer tools = proposals stall post-demo. Drop despite early-stage strength. Forecast gaps tied directly to proposal friction. Regional managers briefed. Coaching assets integrated. | Confusion centered on workflow, not capability. Full-funnel visibility blocked, 2-week launch delays. Clinics wk1, templates embedded wk2, dashboard and local champion support wk3. |
Explore more
Have a read at this post to learn more about emotional case framing and cross-examination: Crack your Case Like an FBI Analyst: Secure the Win and Lock it Down.