
In competitive industries like Tech SaaS and Finance, data isn’t just an asset, it’s the engine behind every strategic move. As a Data & Business Intelligence (BI) Analyst, I specialize in designing scalable, automated, and stakeholder-facing analytics workflows that transform complex data into business insight. A strong analytics workflow seamlessly integrates data extraction, transformation, modeling, and visualization, ensuring data-driven decision-making across teams.
Over the years, I’ve partnered with marketing, sales, and finance leaders to optimize customer acquisition strategies, enhance engagement and attribution models, and streamline reporting processes. I’ve delivered predictive dashboards, conversion-focused reports, and forecasting models that inform budget allocation, territory planning, and campaign optimization. Whether scaling predictive pipelines or answering last-minute executive questions, the goal remains the same: to deliver reliable, interpretable, and actionable insights that drive smarter decisions and empower business leaders.
So before launching any BI project, I start by aligning tools and workflows to the core business need: Will it require multi-source extraction? Does the team need real-time interactivity or scheduled reports? Do we require automated, low-maintenance pipelines or custom ad hoc models?
From these diagnostics, I’ve built three Data Stack “recipes”; modular frameworks, optimized for a specific business context: scalability with cloud-based BI and self-serve dashboards [1], flexibility combining cloud analytics with Excel-based reporting [2], and autonomy with lightweight standalone analytics and reporting for agile teams and niche datasets [3].
1. Scalable Cloud-Based Analytics for Interactive and Self-Serve Dashboards

A Scalable Buffet. Think of this Data stack as a well-curated analytics buffet. Each component serves a distinct purpose, but works best when thoughtfully combined. Just like a buffet allows guests to mix what fits their appetite, this stack gives analysts the choice to tailor workflows to business needs: blending real-time CRM data with marketing predictions, layering in attribution logic, or serving up clean KPIs for executive dashboards. This setup is ideal for organizations seeking scalable, automated data pipelines that support real-time analytics, centralized KPI tracking, and interactive, self-service reporting across departments. With cloud-based automation, optimized initial data processing, and integrated final reporting, this stack adapts to the pace, complexity, and appetite of any modern, cross-functional team.
Use Case. This workflow supports the execution an optimization of data-driven strategies across the entire customer journey. It enables tracking of lead generation, funnel performance, and conversion rates across campaigns; analysis of multi-channel attribution models, and monitoring of sales pipeline progression across products, segments, or geographies. The workflow also supports the integration of predictive outputs to estimate customer lifetime value, lead quality, and engagement scores. Hence, this approach is particularly effective for initiatives focused on cross-functional business execution, predictive analytics optimization, and performance monitoring around centralized KPIs, rather than seasonal or long-term planning.
Ingredients. We typically extract structured data from core business platforms through their dedicated APIs. These platform may include CRM systems (Salesforce, HubSpot), marketing automation tools (Marketo, HubSpot Marketing Hub, Pardot), e-commerce platforms (Shopify, WooCommerce, BigCommerce), and web analytics solutions (Google Analytics). We can also enrich our pipeline with external data sources, whether accessed via dedicated APIs once again (Google Sheets, Google Forms, LinkedIn, Twitter) or through manual imports (Excel files, CSV exports, scraped tables, publicly downloaded datasets).
The Scalable Data Stack Recipe
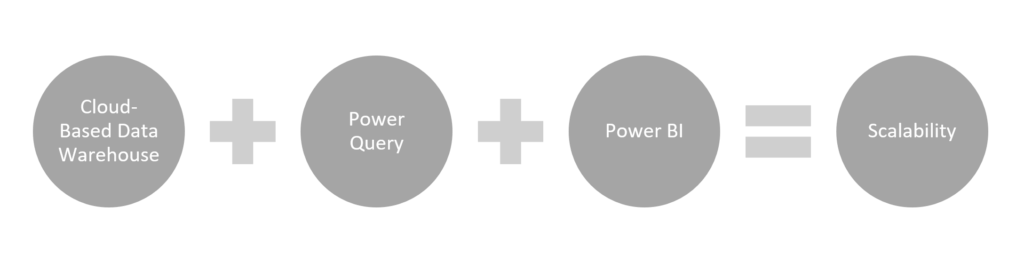
Why does the Data Warehouse need to be Cloud-Based? Our pipeline starts with a cloud-based data warehouse, chosen based on the organization’s existing infrastructure and scale requirements. Cloud solutions like Azure SQL Database, Snowflake, Google BigQuery, Amazon Redshift, or Databricks Delta Lake offer the flexibility, scalability, and performance needed for modern analytics. They enable centralized and structured data access, support SQL-based querying, and allow seamless integration with ETL tools (Extract-Transform-Load) and BI platforms. A cloud architecture also ensures that our workflows remain cost-efficient, collaborative, and easily scalable as data volumes grow.
Why power BI over Tableau? While Tableau is a powerful visualization tool, it often relies on SQL-heavy modeling upstream. This places greater dependence on engineering teams or pre-built data marts. In contrast, Power BI empowers analysts with a more hands-on, end-to-end workflow. With Power Query for data shaping and native support for Python scripts, Power BI enables deeper customization, faster iteration, and a more autonomous analytical experience. For analysts like me who prefer to work close to the data and tailor logic to business needs in real-time, Power BI offers the flexibility and control that makes a difference.
Why Power Query is an essential bridge between the Data Warehouse and Power BI? Power Query serves as a versatile transformation layer between raw data and business insight. It allows analysts to clean, merge, reshape, and model data without needing to push logic back into the warehouse. This creates a more agile and self-sufficient workflow, particularly valuable in fast-moving teams. With support for Python integration, Power Query also enables to combine the data and predictions from the data warehouse with business context, and prepare it for visualization and strategic use in Power BI. It bridges the gap between engineering and analysis, making data preparation accessible, repeatable, and scalable.
The Data Stack Workflow
| Data Warehouse | 1. Extract data from the business platform using a Python scripts and their corresponding APIs, either via real-time synchronization or scheduled batch processing. Store data in a the cloud-based data warehouse for centralized access and scalability. 2. Pre-process data in the warehouse using SQL queries to clean, join and aggregate the datasets. This ensures consistency, data integrity, and performance optimization before modeling or visualization. 3. (optional) Train a machine learning model in an interactive computing environment to enable advanced analytics at scale. Personally, I use Jupyter Lab to build ML models for lead scoring and churn prediction. Once the ML model is trained, deploy it by writing the resulting predictions back into the data warehouse using a new Python script. If needed, reprocess these new fields in the warehouse before proceeding to the next stage. |
| Power Query | 4. Connect Power Query to your structured data via API. You can also extend flexibility by pulling external datasets through direct connections. 5. Clean, merge, and shape the data within Power Query. Perform early-stage calculations using M language directly into Power Query. When needed, enrich the dataset by embedding Python scripts to run lightweight regression or classification ML models directly within the query. This allows you to combine data transformation with predictive scoring to create insight-ready layers before passing them into the dashboarding environment. |
| Power BI | 6. Load enriched data into the Power BI data model. Perform additional advanced calculations using DAX directly inside Power BI to generate performance KPIs, growth trends, and user behavior metrics aligned with business objectives. 7. Build fully interactive dashboards with built-in visualizations such as tables, matrices, bar charts, funnels, and waterfalls. Configure automated refresh cycles to ensure stakeholders consistently access up-to-date, decision-ready data. |
2. Flexible Cloud-Excel-Based Analytics for Recurring Executive Reviews

The Flexible Prix-Fixe Menu. This setup combines the scalability of cloud-based data processing with the structure and automation of Excel-based reporting. Like a prix-fixe menu, the overall flow is predefined and consistent, but each course can still be adjusted to meet evolving tastes. It is especially well-suited to fast-moving business environments where agility is critical. Analysts must provide structured ouputs because formatting, layout consistency, and exact metrics are non-negotiable but they also need to remain flexible enough to accommodate last-minute changes, updated KPIs, or evolving executive priorities without rebuilding the entire process.
Use case. This method is especially suited to produce recurring deliverables that need to be standardized and presentation-ready. It’s primarily used for executive-facing or tailored client-facing reports in finance and sales contexts such as monthly board reports, quarterly business reviews, or PDF exports. These repeatable formats often require fast updates to reflect the latest KPIs aligned with the evolving business targets. This methodology also offers the best balance for sales forecasting, budget planning, territory reallocation, and KPI alignment in environments where strategy evolves month to month with frequent leadership input. Analysts can adjust financial modeling scenarios, segmentation logic, and outputs accuracy quickly, without relying on upstream development. This makes it a powerful tool either for repeatable executive reports or planning sessions.
The Flexible Data Stack Recipe
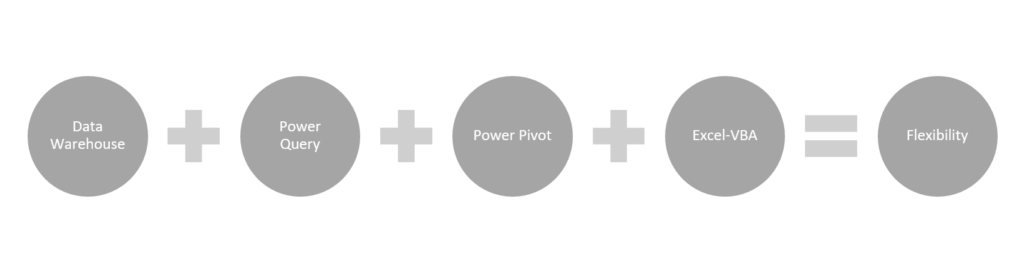
Can we apply this methodology without a Cloud-Based Data Warehouse? This situation applies when the data volume exceeds what’s manageable directly in Access but doesn’t yet justify a full cloud-based infrastructure. In this case, the methodology can still be applied effectively, as long as the upstream data is locally available, well-prepared, and relatively stable. It provides strong control without overengineering, since the process remains auditable, semi-automated, and requires minimal manual handling. It also avoids oversimplification, allowing you to seperate data transformation from business logic modeling and to maintain structured, consitent ouputs. However, if the data becomes larger, more volatile, or spans multiple sources needing coordination, a cloud-based warehouse would improve stability and long-term maintainability.
Why switch from Power BI to Excel and VBA? Power BI is ideal for interactive, real-time dashboards and self-service exploratory analytics supporting execution. But Excel offers tighter control for structured, consitent, presentation-ready reporting, tailored for formal delivery. Combined with VBA automation, it also enables repeatable workflows. While you lose some real-time interactivity, there’s no significant compromise on timeliness, especially for batch-based reporting needs. Hence, when polished output and deliveries matter more than visual exploration, Excel becomes the better fit. While this approach is structured in its output, it also offers analysts greater flexibility. Unlike Power BI, Excel-based reports can be updated, refined, and delivered independently. Excel is more cost-effective and easier to manage, allowing analysts to make fast adjustments without relying on engineering expertise, coordinating with centralized BI modeling teams, or seeking validation from data governance.
Why does Power Pivot become a necessary step after Power Query when switching from Power BI to Excel? Power Query handles data preparation by cleaning, merging, and reshaping inputs, but it doesn’t store or model the data. In Power BI, that modeling layer is built-in. In Excel, it isn’t because it lacks the in-memory engine. So Power Pivot takes over that role. It receives the structured output from Power Query and builds the semantic model by defining relationships, creating calculated columns, and applying DAX-based measures, hence enabling high-performance in-memory analytics directly within Excel. Together, Power Query and Power Pivot create a seamless flow from raw data to structured, insight-ready reporting tailored for Excel-based deliverables.
The Data Stack Workflow
| Data Warehouse | 1. Extract data from the business platform using a Python scripts and their corresponding APIs, either via real-time synchronization or scheduled batch processing. Store data in a the cloud-based data warehouse for centralized access and scalability. 2. Pre-process data in the warehouse using SQL queries to clean, join and aggregate the datasets. This ensures consistency, data integrity, and performance optimization before modeling or visualization. 3. (optional) Train a machine learning model in an interactive computing environment to enable advanced analytics at scale. Personally, I use Jupyter Lab to build ML models for lead scoring and churn prediction. Once the ML model is trained, deploy it by writing the resulting predictions back into the data warehouse using a new Python script. If needed, reprocess these new fields in the warehouse before proceeding to the next stage. |
| Power Query | 4. Connect Power Query to your structured data via API. You can also extend flexibility by pulling external datasets through direct connections. 5. Clean, merge, and shape the data within Power Query. Perform early-stage calculations using M language directly into Power Query. When needed, enrich the dataset by embedding Python scripts to run lightweight regression or classification ML models directly within the query. This allows you to combine data transformation with predictive scoring to create insight-ready layers before passing them into the dashboarding environment. |
| Power Pivot | 6. Load enriched data into the Power Pivot model. Perform additional advanced calculations using DAX directly inside Power Pivot to generate performance KPIs, growth trends, and user behavior metrics aligned with business objectives. |
| Excel-VBA | 7. Connect the Power Pivot model to Excel for final reporting. 8. Build structured reports using PivotTables, bar charts, funnels, and waterfalls. Configure automated report priting and export to PDF or PowerPoint using VBA. |
3. Custom Standalone Excel-Based Analytics for Sample Testing and Ad-Hoc Reporting

The Autonomous Made-to-Order. This approach is best when autonomy and speed matter more than scale. It’s suited for cases where the data is too lightweight for a full RDBMS (Relational Database Management System), too structured for Power Query, and too small to justify cloud orchestration, yet still important enough to require consistent reporting. Like a made-to-order kitchen, every report is crafted by hand, based on the specific needs of the moment. It supports custom post-processing of datasets typically under 10,000 rows, print-ready formatting, and VBA-powered automation in Excel. While the data flow is more manual, it’s highly adaptable. Analysts work locally, and control every step, from extraction to delivery, making it a perfect match for custom deliverables, ad hoc performance packs, or legacy-reporting scenarios.
Use case. It is perfect for workflows where reporting needs to be fast, customized, and manually overseen such as client-specific packs, performance summaries or one-off reporting needs. It’s well-suited for lightweight sales tracking and reviewing marketing efficiency based on predefined KPIs. Analysts can also quickly compile urgent calls to action for sales and marketing managers across multiple product lines or business units using lead scoring, engagement metrics, and business priorities. It enables initial exploratory analysis as well on customer research or competitive intelligence to surface simple customer segments or highlight top-performing products. While Excel supports basic analytics, it is not suited for advanced regression or classification modeling. This setup is more appropriate for testing logic, validating assumptions, or shaping insights for strategic follow-up.
The Autonomous Data Stack Recipe
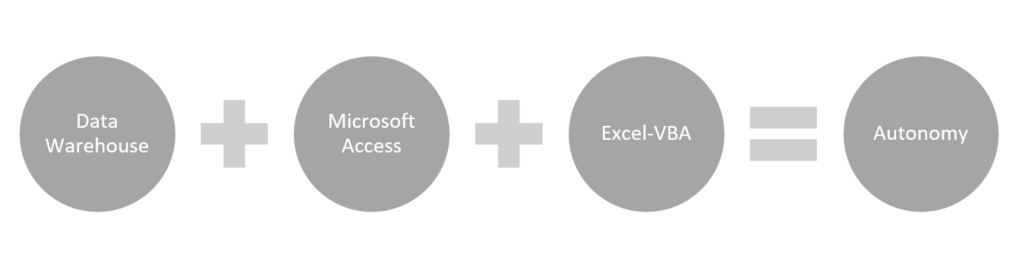
Why switch from Power Query and Power Pivot to Microsoft Access? You switch when you need more autonomy, simplicity, or local control than scalability and advanced modeling. Access is better suited for smaller datasets _ under 10,000 rows as we said earlier _ that don’t require complex relationships or DAX-based calculations. It becomes especially useful when data comes from static exports or lives on local drives. It only needs quick joins, filters and aggregations without the overhead of a semantic model. Indeed, in Access, there is no “model” layer like in Power Pivot or Power BI. You manage data through tables, define relationships manually, and perform calculations or aggregations within queries. It’s relational, but not semantic meaning that you don’t define reusable measures or metrics. Everything is query-based, and if you need a metric, you compute it each time inside the query or do it later in Excel. As a result, Access offers a lightweight, flexible relational layer that integrates seamlessly with Excel and VBA without relying on cloud infrastructure or centralized governance.
What if I really need to perform Machine Learning modeling on a small sample and want to avoid Power Query? The best approach is to handle the ML modeling upstream in Python within Jupyter Lab for instance, then export the predictions or classifications as additional fields in your dataset. You can then import that enriched file into Access or Excel for reporting. Excel alone can handle very basic linear and logistic regression via the Data Analysis ToolPak or formulas, but it’s not reliable for classification or more advanced ML models.
The Data Stack Workflow
| Data Warehouse | 1. (optional) Extract data from the business platform using a Python scripts and their corresponding APIs, either via real-time synchronization or scheduled batch processing. Store data in a the cloud-based data warehouse for centralized access and scalability. 2. (optional) Pre-process data in the warehouse using SQL queries to clean, join and aggregate the datasets. This ensures consistency, data integrity, and performance optimization before downstream use. 3. (optional) Train a machine learning model in an interactive computing environment to enable advanced analytics at scale. Personally, I use Jupyter Lab to build ML models for lead scoring and churn prediction. Once the ML model is trained, deploy it by writing the resulting predictions back into the data warehouse using a new Python script. If needed, reprocess these new fields in the warehouse before proceeding to the next stage. |
| Microsoft Access | 4. Export structured datasets from the data warehouse or other business platforms into flat files (CSV or Excel), then import them into Microsoft Access for local relational processing. 5. Clean, merge, and shape the data within Access by using queries or expressions. Combine multiple exports, filter subsets, and organize structured tables for reporting. This step is useful when datasets are too complex for flat Excel use, but don’t require full Power Pivot modeling. Since Access does not support embedded Python scripts, this stage is not suitable for running regressions or classification ML models. Those should be performed upstream if needed. |
| Excel-VBA | 6. Load a structured dataset of less thant 10,000 rows into Excel using a Microsoft Query (ODBC) connection to Microsoft Access. 7. Perform additional calculations in Excel using formulas (SUMIFS, INDEX-MATCH …) or VBA modules to generate performance KPIs, growth trends, and user behavior metrics aligned with business objectives. You can exceptionally perform very basic linear and logistic regressions using the Excel Data Analysis ToolPak. 8. Build structured reports using PivotTables, charts, and formatted layouts. Use VBA to automate report generation and export to PDF or PowerPoint for delivery. |
Explore more
Now that you know how to cook up the best Data stack for your needs, it’s time to put it to work. Check out this blog post to explore the different types of analysis you can perform on your data: The Data Analytics Lifecycle: From Exploration to Prescription